Polar codes are easily the most significant recent development in the areas of coding and information theory research. A wide variety of applications have been proposed for polar codes mainly due to their capacity achieving property for many different communication channels.
In this post, we explore the trends in research publications on the topic of polar codes in their brief but exciting history.
This post also serves as a tutorial in exploratory data analysis using Python and Pandas along with Matplotlib for plotting.
%matplotlib inline

import matplotlib
import matplotlib.pyplot as plt
matplotlib.style.use('ggplot')

import numpy as np
import pandas as pd
import re

# Make the graphs a bit prettier, and bigger
pd.set_option('display.mpl_style', 'default')

matplotlib.rcParams['font.size'] = 14.0
matplotlib.rcParams['font.sans-serif'] = 'Avant Garde'
matplotlib.rcParams['xtick.labelsize'] = 'large'
matplotlib.rcParams['ytick.labelsize'] = 'large'

# Other Pandas options
pd.set_option('display.width', 5000)
pd.set_option('display.max_columns', 60)
pd.options.mode.chained_assignment = None
Data Collection and Cleaning
For our analysis, it is sufficient to work with research publication citation data which is available from IEEE Xplore. We download the data using two search strings “polar codes” and “channel polarization”.
# Read raw data from IEEE Xplore using search strings
# 'polar codes' and 'channel polarization'
pcdf1 = pd.read_csv('ieee_data/polar_codes_export2015.08.29-15.43.27.csv',
                    skiprows = 1)
pcdf2 = pd.read_csv('ieee_data/channel_polarization_export2015.08.29-15.55.28.csv',
                    skiprows = 1)

# Merge the two data frames
pcdf = pd.concat([pcdf1, pcdf2], ignore_index = True)

# Rename columns to remove spaces in column names
pcdf.rename(columns=lambda x: x.replace(' ', '_'), inplace=True)

# Remove duplicate rows from the merged data frame
pcdf = pcdf.drop_duplicates()
However, the set of publications obtained is not entirely clean and there are some papers with the word “polarization” in their titles or abstracts that show up in our dataset but are not related to polar codes. We can clean them up using regular expression based filtering as follows. We also know that polar codes were invented in the year 2008 and hence can safely eliminate any papers with a publication date earlier than 2008.
# Construct a regex string to filter entries in the data frame
# not related to polar codes
polar_codes_regex_str = ('([pP]olar [cC]odes)|([cC]hannel [pP]olarization)|'
                         '[rR]ate.*[pP]olarization|[pP]olarized.*[cC]hannels|'
                         '[cC]hannels.*[pP]olarized')
relevant_titles = pcdf.Document_Title.str.contains(polar_codes_regex_str,
                                flags=re.IGNORECASE, regex=True, na=False)
pcdf = pcdf[relevant_titles]

# Remove entries from earlier than 2008 as we know
# polar codes were invented in 2008.
pcdf = pcdf[pcdf['Year'] >= 2008]
Exploratory Data Analysis
As a first step, we can simply look at the total number of papers published on polar codes in every year as follows.
# Study the total number of 'polar code' publications with years
pub_counts_per_year = pcdf['Year'].value_counts(sort = False)

fig_1 = plt.figure(figsize=[15, 5])
pub_counts_per_year.plot(kind='bar')
plt.xlabel('Year')
plt.ylabel('Number of Publications')
plt.title("Total Publications on Polar Codes")
plt.show()
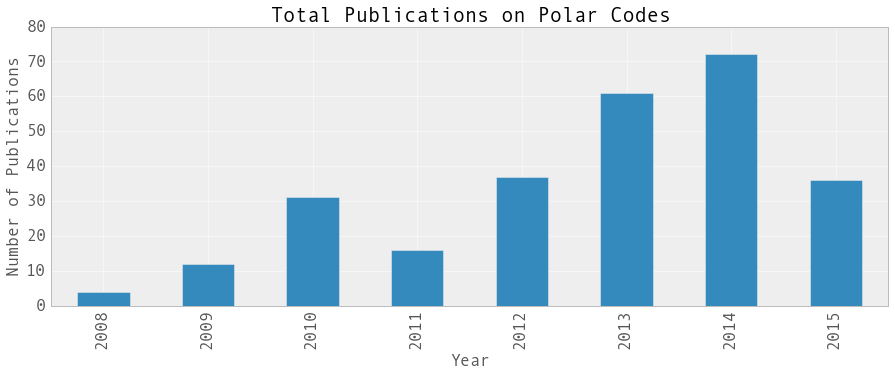
From the plot above, it very exciting to see that polar code research has been growing steadily since 2012 with the last year of 2014 recording well over 70 publications. The number of publications in 2015 seems a bit low however, the publications from recent conferences in 2015 such as ISIT and ICC are yet to appear on IEEE Xplore.
Next we look at the type of publications in our dataset. In our analysis, we want to focus on IEEE Conference or Journal publications. We look at the total number of IEEE Conference and IEEE Journal publications in every year as follows.
pcdf_grouped = pcdf.groupby('Document_Identifier')
pub_counts_per_year_2 = pcdf_grouped['Year'].value_counts(sort = False)
pub_counts_per_year_conf = pub_counts_per_year_2['IEEE Conference Publications']
pub_counts_per_year_journal = pub_counts_per_year_2['IEEE Journals & Magazines']

fig_2 = plt.figure(figsize=[15, 5])

plt.subplot(121)
pub_counts_per_year_conf.plot(kind='bar')
plt.ylim([0, 50])
plt.xlabel('Year')
plt.ylabel('Number of Publications')
plt.title('IEEE Conferences')

plt.subplot(122)
pub_counts_per_year_journal.plot(kind='bar')
plt.ylim([0, 50])
plt.xlabel('Year')
plt.title('IEEE Journals')
plt.show()
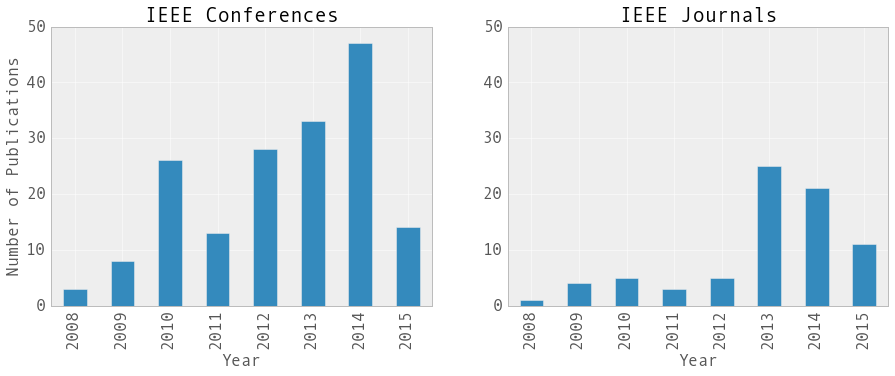
Clearly, the conference papers outnumber the journal publications by a significant margin and this is expected. The year 2013 seems to represent a peak in journal publications but it is difficult to conclude much as one must keep in mind the large turnaround times for journal publication reviews.
As IEEE conference publications make up most of the polar code publications in the dataset, one would be interested in knowing which conferences are popular venues for presenting polar code research. For this we can create a scatter plot as follows using knowledge of 8 popular IEEE conferences in information theory and coding theory research which are ISIT, ITW, Allerton, ICC, ICNC, WCNC, GLOBECOM, and Asilomar conferences.
# Study the publication counts grouped by major IEEE conferences in every year
pcdf_confs = pcdf[pcdf['Document_Identifier'] == 'IEEE Conference Publications']
unique_confs = pd.unique(pcdf_confs.Publication_Title.ravel())

conf_names = ['ISIT', 'ITW', 'Allerton', 'ICC', 'ICNC', \
              'WCNC', 'GLOBECOM', 'Asilomar']

def get_conf_name(x, conf_names):
    is_conf = np.array([y in x for y in conf_names])
    if np.sum(is_conf):
        return conf_names[np.arange(len(conf_names))[is_conf]]
    else:
        return ''

pcdf_confs['IEEE_Conference'] = \
        pcdf_confs['Publication_Title'].map(lambda x: get_conf_name(x, conf_names))

pcdf_confs_grouped = pcdf_confs.groupby('IEEE_Conference')
pcdf_confs_grouped_counts = pcdf_confs_grouped['Year'].value_counts(sort = False)
pcdf_confs_grouped_counts = pcdf_confs_grouped_counts.unstack(-1)
pcdf_confs_grouped_counts = pcdf_confs_grouped_counts.fillna(0)
pcdf_confs_grouped_counts = pcdf_confs_grouped_counts[1:]

fig_3 = plt.figure(figsize=[15, 5])
ax = plt.subplot(111)
ylabel_list = []
ylabel_ticks = []
xlabel_list = [str(x) for x in pcdf_confs_grouped_counts.columns]
xlabel_ticks = [int(x) for x in pcdf_confs_grouped_counts.columns]
plot_colors = ["#9b59b6", "#3498db", "#95a5a6", "#e74c3c", \
               "#34495e", "#2ecc71", "#b05b6f", "#008080"]
yoffset = 0
i = 0
for conf in pcdf_confs_grouped_counts.index:
    ax.scatter(x=pcdf_confs_grouped_counts.columns,
                y=np.array([0]*len(pcdf_confs_grouped_counts.columns)) + yoffset,
                s=pcdf_confs_grouped_counts.loc[conf, :]*70, color=plot_colors[i])
    ylabel_ticks.append(yoffset)
    ylabel_list.append(conf)
    yoffset += 5
    i += 1

ax.set_yticks(ylabel_ticks)
ax.set_yticklabels(ylabel_list)
ax.set_xticks(xlabel_ticks)
ax.set_xticklabels(xlabel_list)
plt.xlabel('Year')
plt.title("Publication Count for Conferences")
plt.show()
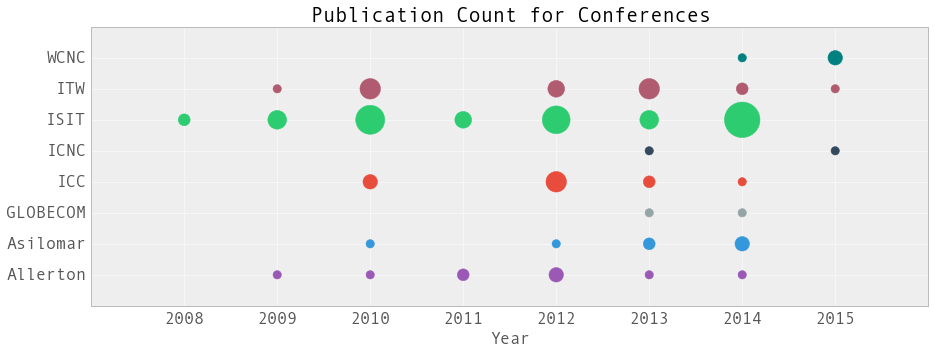
Clearly, the IEEE International Symposium on Information Theory (ISIT) seems to be the most popular conference for publishing polar code papers followed by the IEEE Information Theory Workshop (ITW) and the IEEE International Conference on Communications (ICC). We also see that the data for 2015 is incomplete as the ISIT-2015 and ICC-2015 conference proceedings are yet to appear on IEEE Xplore and the Allerton conference and GLOBECOM-2015 are yet to happen in October and December 2015 respectively.