A trellis diagram is a representation of a convolutional code. During the study of convolutional and turbo codes, one often encounters situations where we would like to visualize the trellis diagram representation of a simple 4-state or an 8-state convolutional code.
CommPy is an open source toolkit implementing digital communication algorithms in Python using NumPy,SciPy, Matplotlib and Cython. The visualize function in CommPy’s Trellis class is an attempt to make plotting trellis diagrams easy and simple. Here’s how to use it.
from numpy import array
from commpy.channelcoding import Trellis

# Define the number of memory elements
# per input in the convolutional encoder
memory = array([2])

# Define the generator matrix of
# the convolutional encoder
# Entries are in octal format
g_matrix = array([[05, 07]])

# Create a trellis representation
# from the encoder generator matrix
trellis = Trellis(memory, g_matrix)

# Specify the number of time steps
# in the trellis diagram
trellis_length = 3

# Specify the order in which states
# should appear on the trellis diagram
state_order = [0, 2, 1, 3]

# Specify the colors for 0, 1 inputs
# '#FF0000' --> Red   (edge corresponding to input 0)
# '#00FF00' --> Green (edge corresponding to input 1)
bit_colors = ['#FF0000', '#00FF00']

# Plot the trellis diagram
trellis.visualize(trellis_length, state_order,
                  edge_colors = bit_colors)
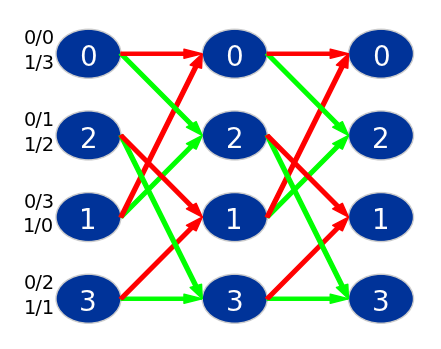
A 4-state trellis diagram
Shown below is another trellis diagram representation of the encoder matrix
$$ G(D)=[1+D^2+D^3,1+D+D^2+D^3] $$
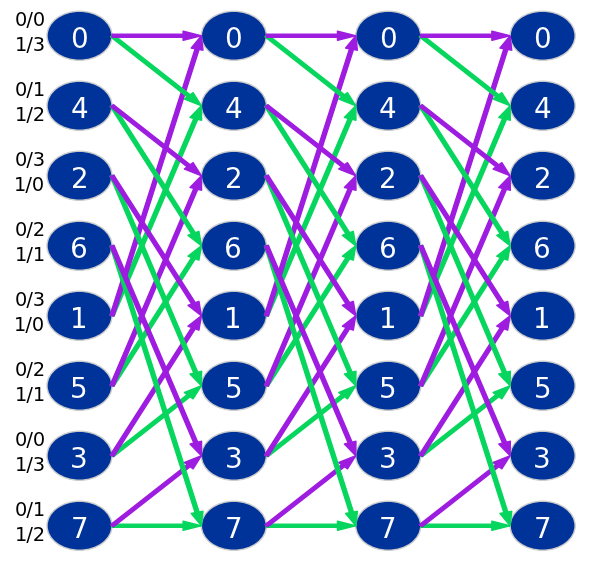
An 8-state trellis diagram